ボラティリティをはかる
シンプルにボラティリティをはかるというインジケータが標準装備されていないのは何故だろう。
ボラティリティー(Volatility)とは、一般的に価格変動の度合いを示す言葉で、「ボラティリティーが大きい」という場合は、その商品の価格変動が大きいことを意味し、「ボラティリティーが小さい」という場合は、その商品の価格変動が小さいことを意味します。
ボラティリティをごくシンプルに表現するなら、それはある時点から見た時のレートの変動率のことだろう。
変動幅で見ることもあるかもしれないが、一般的には前者のように思う。
MT5であれば、その日の変動率を気配値表示ウィンドウに表示することができる。
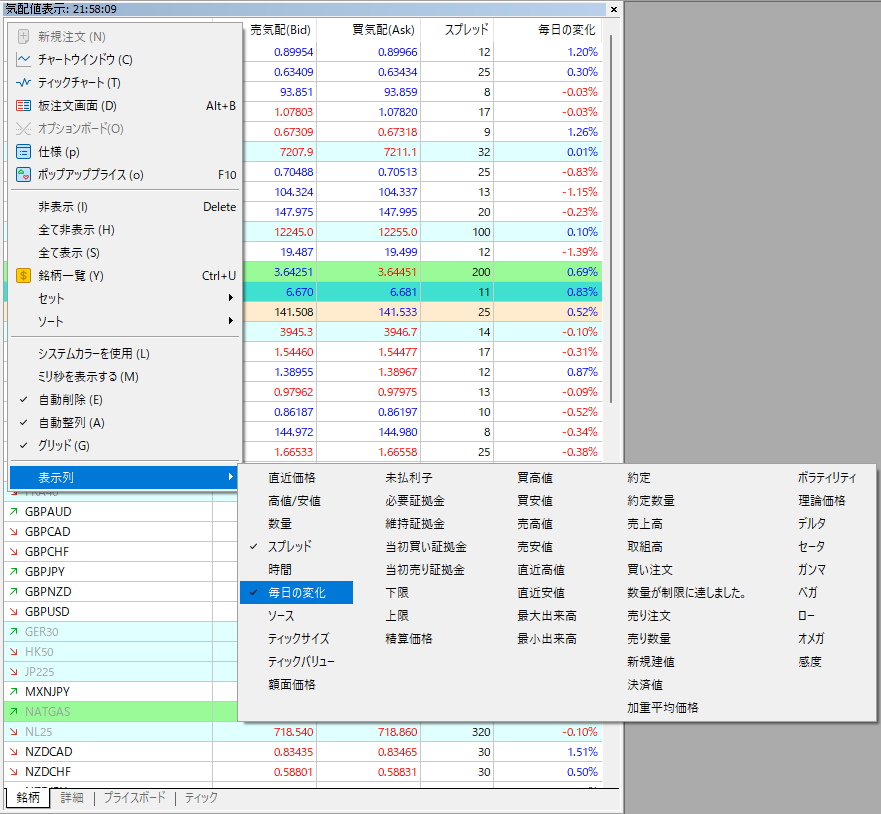
上の図の「毎日の変化」にチェックを入れれば、銘柄の行にその日の始値~現在値までの変化率が表示される。
(なお、「ボラティリティ」にチェックを入れても意味が無いが、これは何だろう…)
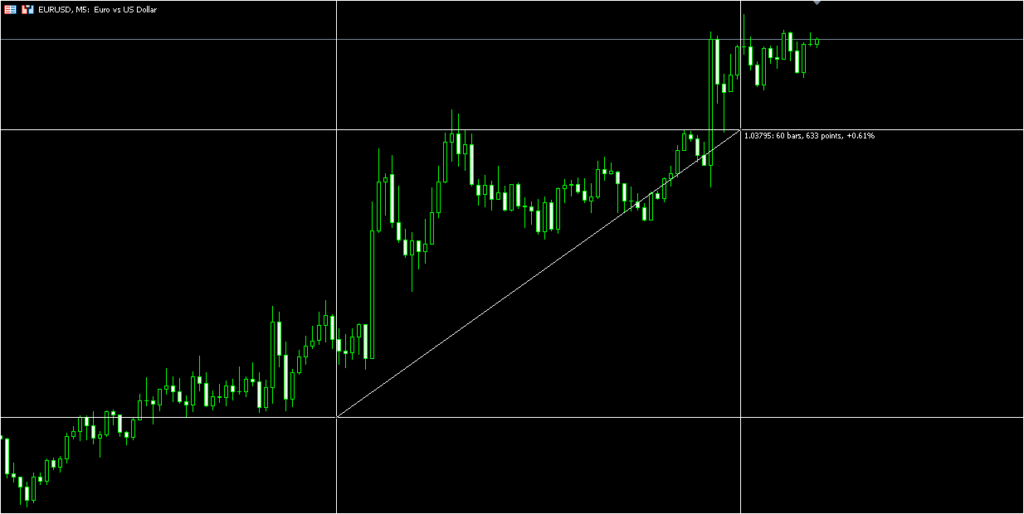
また、チャート上の任意の距離を測る際にも、始点と終点までの変化率が表示される。
標準装備のインジケータの中にこれらの値を示してくれるものが無い。
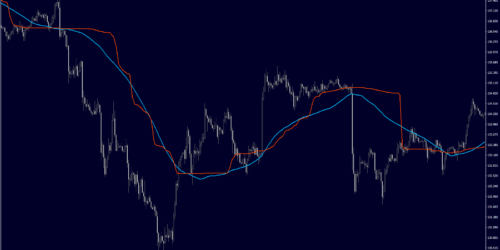
例えば、バー1本1本について、始値から終値までの変化率を表示するインジケータなら、以下のようになる。
#property copyright "nisai"
#property link      "https://nisaifx.com"
#property version   "1.00"
#property strict
#property description "Volatility of Bars"
#property indicator_separate_window
#property indicator_buffers 1
#property indicator_plots   1
#property indicator_label1  "Volatility of Bars"
#property indicator_type1   DRAW_LINE
#property indicator_color1  clrRed

double volatility_buffer[];

int OnInit(){
   SetIndexBuffer(0,volatility_buffer);
   PlotIndexSetString(0,PLOT_LABEL,"Volatility of Bars");
   PlotIndexGetInteger(0,PLOT_DRAW_BEGIN,0);
   return INIT_SUCCEEDED;
}
int OnCalculate(const int rates_total,
                const int prev_calculated,
                const datetime &time[],
                const double &open[],
                const double &high[],
                const double &low[],
                const double &close[],
                const long &tick_volume[],
                const long &volume[],
                const int &spread[]){
   int position=
      prev_calculated>1
         ? prev_calculated-1
         : 0;
   for(int i=position;i<rates_total&&!IsStopped();i++){
      volatility_buffer[i]=MathAbs(NormalizeDouble(close[i]/open[i]*100-100,3));
   }
   return rates_total;
}
これを表示したものが下の図。
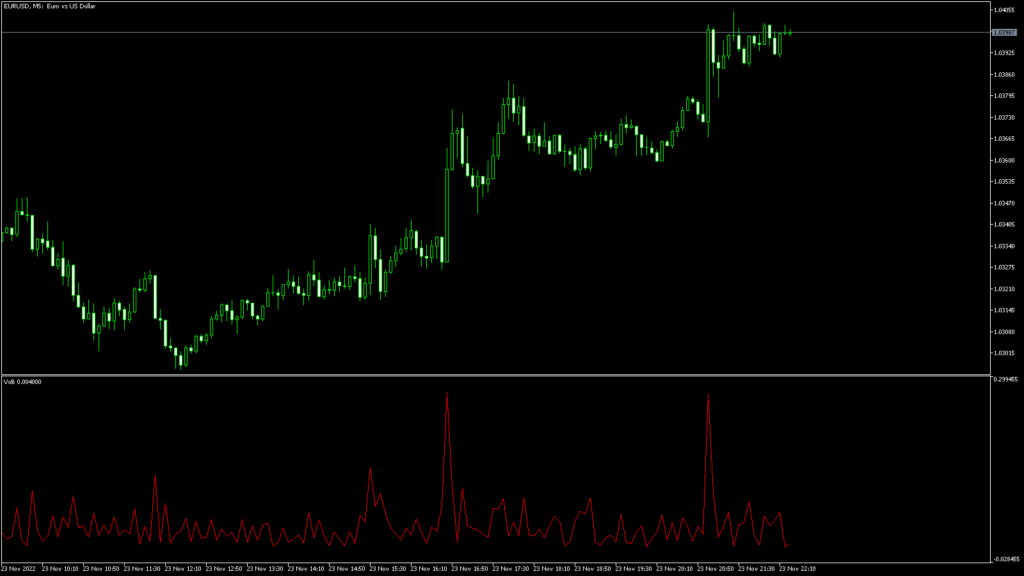
殆ど計算という計算をしていないインジケータだが、必要であれば下のリンクからどうぞ。