移動中央線
最もポピュラーなインジケータは移動平均線かもしれない。
移動平均線が使っている平均値は、いわゆる代表値というもののひとつ。
”代表値”でググると、総務省統計局の「中心的な傾向を捉える」というページがヒットした。
集団の中心的傾向を示す値を「代表値」といいます。代表値としては、一般に平均値が使われますが、分布の形によっては最頻値や中央値を代表値にする場合もあります。
”平均値”、”最頻値”、”中央値”の3つの代表値が紹介されている。
平均値は、集団であるデータを合計してデータ数で割った数値。
最頻値は、集団であるデータの中で最もよく見られる数値。
中央値は、集団であるデータを値の大きさ順に並べた時、真ん中に位置する数値。
それぞれの値の違いは次のように説明されている。
中心を表すそれぞれの指標の最も特徴的な違いは、外れ値の影響をどのくらい受けるかということです。
あるデータに外れ値が加わった場合、平均値は三つの指標の中で最も影響を受けるデータといってもよいでしょう。中央値は、データを並べてちょうど真ん中にくる値なので、外れ値が増えても、多くの場合はそれほど影響ありません。また、モードは最も頻度の高い数値となるので、外れ値の影響はまず受けません。(中略)
代表値はその名のとおり、データの特徴を表すのに最も重要な値と言えるでしょう。代表値を使用する場合は、データの特徴や分析手法を考慮し、最も的確な値を使用しましょう。
なお”モード”というのは、最頻値のこと。
どう使うのかは置いといて、移動中央線や移動最頻線があっても良いと感じるのは至極当たり前の事に思う。
移動中央線は複雑な処理がないので、簡単に書くことができる。
#property copyright "nisai"
#property link      "https://nisaifx.com"
#property version   "1.00"
#property strict
#property description "Moving Median"
#property indicator_chart_window
#property indicator_buffers 1
#property indicator_plots   1
#property indicator_label1  "Moving Median"
#property indicator_type1   DRAW_LINE
#property indicator_color1  clrRed
#property indicator_style1  STYLE_SOLID
#property indicator_width1  1

input int period=20;   //期間
input ENUM_APPLIED_PRICE applied_price=PRICE_CLOSE;   //適用価格
input int shift=0;   //シフト

double median_buffer[];

int OnInit(){
   if (period<=0){
      Alert("0以上の期間を指定する必要があります。");
      return INIT_PARAMETERS_INCORRECT;
   }
   SetIndexShift(0,shift);
   IndicatorShortName("Moving Median("+IntegerToString(period)+")");
   SetIndexDrawBegin(0,period-1);
   SetIndexBuffer(0,median_buffer);
   return INIT_SUCCEEDED;
}
int OnCalculate(const int rates_total,
                const int prev_calculated,
                const datetime &time[],
                const double &open[],
                const double &high[],
                const double &low[],
                const double &close[],
                const long &tick_volume[],
                const long &volume[],
                const int &spread[]){
   if(rates_total<period){
      return 0;
   }
   int changed_bars=prev_calculated==0?rates_total:rates_total-prev_calculated+1;
   int limit=MathMin(changed_bars,rates_total-period+1);
   for(int i=0;i<limit;i++){
      double tmp_array[];
      ArrayResize(tmp_array,period);
      if(applied_price==PRICE_CLOSE){
         tmp_array[j]=close[i+j];
      }else if(applied_price==PRICE_OPEN){
         tmp_array[j]=open[i+j];
      }else if(applied_price==PRICE_HIGH){
         tmp_array[j]=high[i+j];
      }else if(applied_price==PRICE_LOW){
         tmp_array[j]=low[i+j];
      }else if(applied_price==PRICE_MEDIAN){
         tmp_array[j]=(high[i+j]+low[i+j])/2;
      }else if(applied_price==PRICE_TYPICAL){
         tmp_array[j]=(high[i+j]+low[i+j]+close[i+j])/3;
      }else if(applied_price==PRICE_WEIGHTED){
         tmp_array[j]=(high[i+j]+low[i+j]+close[i+j]+close[i+j])/4;
      }
      ArraySort(tmp_array);
      if(period%2==0){
         //期間が偶数の場合は中央値が2つあるため、合計して2で割った数値を求める
         median_buffer[i]=NormalizeDouble((tmp_array[period/2]+tmp_array[period/2-1])/2,Digits);
      }else{
         median_buffer[i]=tmp_array[(period-1)/2];
      }
   }
   return rates_total;
}
#property copyright "nisai"
#property link      "https://nisaifx.com"
#property version   "1.00"
#property strict
#property description "Moving Median"
#property indicator_chart_window
#property indicator_buffers 1
#property indicator_plots   1
#property indicator_label1  "Moving Median"
#property indicator_type1   DRAW_LINE
#property indicator_color1  clrRed

input int period=20;   //期間
input int shift=0;   //シフト

double median_buffer[];
int plot_begin=0;

int OnInit(){
   if (period <= 0){
      Alert("0以上の期間を指定する必要があります。");
      return INIT_PARAMETERS_INCORRECT;
   }
   SetIndexBuffer(0,median_buffer);
   PlotIndexSetInteger(0,PLOT_SHIFT,shift);
   PlotIndexSetString(0,PLOT_LABEL,"Moving Median("+IntegerToString(period)+")");
   PlotIndexGetInteger(0,PLOT_DRAW_BEGIN,period);
   SetIndexBuffer(0,median_buffer);
   return INIT_SUCCEEDED;
}
int OnCalculate(const int rates_total,
                const int prev_calculated,
                const int begin,
                const double &price[]){
   if(rates_total<period){
      return 0;
   }
   if(plot_begin!=period+plot_begin){
      plot_begin=period+plot_begin;
      PlotIndexSetInteger(0,PLOT_DRAW_BEGIN,plot_begin);
   }
   int position=
      prev_calculated>1
         ? prev_calculated-1
         : 0;
   for(int i=position;i<rates_total&&!IsStopped();i++){
      if(i>=period){
         double tmp_array[];
         ArrayResize(tmp_array,period);
         for(int j=0;j<period;j++){
            tmp_array[j]=price[i-j];
         }
         ArraySort(tmp_array);
         if(period%2==0){
            //期間が偶数の場合は中央値が2つあるため、合計して2で割った数値を求める
            median_buffer[i]=NormalizeDouble((tmp_array[period/2]+tmp_array[period/2-1])/2,Digits());
         }else{
            median_buffer[i]=tmp_array[(period-1)/2];
         }
      }
   }
   return rates_total;
}
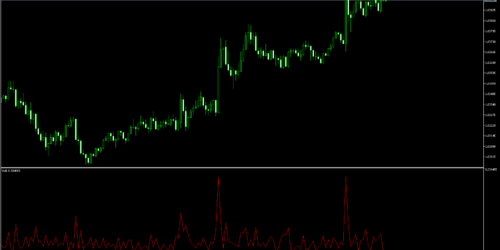
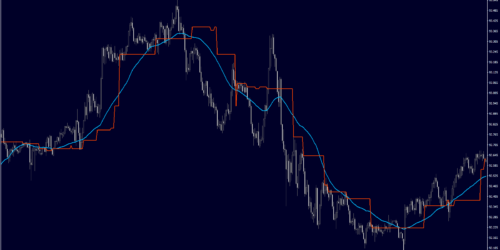
表示すると下図の赤線のように表示される。
比較のために同期間の移動平均線(青線)を表示している。

コンパイル済みのインジケータファイルは下のリンクからどうぞ。