移動最頻線
最頻値は、集合であるデータの中で最もよくみられる数値。
移動最頻線を描くためにはレートの出現回数を調べる必要がある。
ローソク足の終値をいくつ数えても一致するレートが出現する頻度は非常に低いので意味がない。
ローソク足から判断する場合は、そのローソク足の安値~高値までの全てのレートが出現したとして数えていく。
ヒゲを付けている場合は、ヒゲの先頭を除いてヒゲから実体までのレートは少なくとも2回出現していることになるが、ややこしいので無視することにして、ローソク足1本につき、安値~高値までの全てのレートが1回出現したと考える。
これを指定期間分のローソク足全てでカウントし、最も多いレートを最頻値とする。
レートの単位をポイントで考えた場合、たった10pipsだけ動いたローソク足1本でさえ100個のレートをカウントしなければならず、それを何本も繰り返すとなると頭が痛いので、1pip単位に丸めてしまう事にする。
丸める際には端数を内側と外側のどちらに丸めるか、もしくは四捨五入するかという選択が必要になる。
ただし、高値を四捨五入で計算した場合、安値は五捨六入にして処理の意味を合わせる。
また、最頻値が複数個確認できる場合にも、古い最頻値と新しい最頻値のどちらを採用するか、もしくは平均を取るべきかの選択が必要になる。
#property description "Moving Mode"
#property strict
#property indicator_chart_window
#property indicator_buffers 1
#property indicator_plots   1
#property indicator_label1  "Moving Mode"
#property indicator_type1   DRAW_LINE
#property indicator_color1  clrRed
#property indicator_style1  STYLE_SOLID
#property indicator_width1  1

enum ENUM_MODE_ADOPT{
   ENUM_MODE_ADOPT_FIRST=1,  //新しい最頻値を採用(反応が早い)
   ENUM_MODE_ADOPT_LAST=2,   //古い最頻値を採用(反応が遅い)
   ENUM_MODE_ADOPT_AVERAGE=3    //最頻値の平均を採用
};

enum ENUM_RATE_NORMALIZE{
   ENUM_RATE_NORMALIZE_ROUND=1,  //高値四捨五入/安値五捨六入
   ENUM_RATE_NORMALIZE_EXPANSION=2,  //拡張(安値切捨/高値切上)
   ENUM_RATE_NORMALIZE_REDUCTION=3  //縮小(安値切上/高値切捨)
};

input int period=20; //期間
input ENUM_RATE_NORMALIZE normalize=ENUM_RATE_NORMALIZE_REDUCTION;  //ポイント単位の処理方法
input ENUM_MODE_ADOPT adopt=ENUM_MODE_ADOPT_FIRST;  //最頻値複数出現時の処理方法
input int shift=0;   //シフト

double mode_buffer[];

#include <Arrays/ArrayObj.mqh>

class RateData : public CObject{
   private:
      int rate;
      int count;
   public:
      RateData(void){
         rate=0;
         count=0;
      };
      RateData(int r,int c) : rate(r),count(c){};
      void SetRate(int r){
         rate=r;
      };
      int GetRate(){
         return rate;
      };
      void SetCount(int c){
         count=c;
      };
      int GetCount(){
         return count;
      };
};

int OnInit(){
   if(period<=0){
      Alert("0以上の期間を指定する必要があります。");
      return INIT_PARAMETERS_INCORRECT;
   }
   SetIndexShift(0,shift);
   IndicatorShortName("Moving Mode("+IntegerToString(period)+")");
   SetIndexDrawBegin(0,period-1);
   SetIndexBuffer(0,mode_buffer);
   return INIT_SUCCEEDED;
}

int OnCalculate(const int rates_total,
                const int prev_calculated,
                const datetime &time[],
                const double &open[],
                const double &high[],
                const double &low[],
                const double &close[],
                const long &tick_volume[],
                const long &volume[],
                const int &spread[]){
   if(rates_total<period){
      return 0;
   }
   int changed_bars=
      prev_calculated==0
         ? rates_total
         : rates_total-prev_calculated+1;
   int limit=MathMin(changed_bars,rates_total-period+1);
   for(int i=0;i<limit;i++){
      int int_low=0;
      int int_high=0;
      CArrayObj rd_array;
      CArrayObj tgt_array;
      int max_count=1;
      for(int j=0;j<period;j++) {
         if(normalize==ENUM_RATE_NORMALIZE_ROUND){
            int_low=(int)(low[i+j]/(Point*10)+0.4);
            int_high=(int)(high[i+j]/(Point*10)+0.5);
         }else if(normalize==ENUM_RATE_NORMALIZE_EXPANSION){
            int_low=(int)(low[i+j]/(Point*10));
            int_high=(int)(high[i+j]/(Point*10)+0.9);
         }else if(normalize==ENUM_RATE_NORMALIZE_REDUCTION){
            int_low=(int)(low[i+j]/(Point*10)+0.9);
            int_high=(int)(high[i+j]/(Point*10));
         }
         for(int k=int_low;k<=int_high;k++){
            if(rd_array.Total()>0){
               bool exist=false;
               for(int l=0;l<rd_array.Total();l++){
                  RateData *rd=rd_array.At(l);
                  if(rd.GetRate()==k) {
                     exist = true;
                     rd.SetCount(rd.GetCount()+1);
                     if(max_count<rd.GetCount()){
                        max_count=rd.GetCount();
                     }
                  }
               }
               if(!exist){
                  rd_array.Add(new RateData(k,1));
               }
            } else {
               rd_array.Add(new RateData(k,1));
            }
         }
      }
      for(int j=0;j<rd_array.Total();j++){
         RateData *rd=rd_array.At(j);
         if(rd.GetCount()==max_count){
            tgt_array.Add(rd);
         }
      }
      if(adopt==ENUM_MODE_ADOPT_FIRST){
         RateData *rd=tgt_array.At(tgt_array.Total()-1);
         mode_buffer[i]=rd.GetRate()*(Point*10);
      }else if(adopt==ENUM_MODE_ADOPT_LAST){
         RateData *rd=tgt_array.At(0);
         mode_buffer[i]=rd.GetRate()*(Point*10);
      }else if(adopt==ENUM_MODE_ADOPT_AVERAGE){
         int tgt_sum=0;
         for(int j=0;j<tgt_array.Total();j++){
            RateData *rd=tgt_array.At(j);
            tgt_sum+=rd.GetRate();
         }
         mode_buffer[i]=(tgt_sum/tgt_array.Total())*(Point*10);
      }
   }
   return rates_total;
}
#property copyright "nisai"
#property link      "https://nisaifx.com"
#property version   "1.00"
#property strict
#property description "Moving Mode"
#property indicator_chart_window
#property indicator_buffers 1
#property indicator_plots   1
#property indicator_label1  "Moving Mode"
#property indicator_type1   DRAW_LINE
#property indicator_color1  clrRed

#include <Arrays/ArrayObj.mqh>

enum ENUM_MODE_ADOPT{
   ENUM_MODE_ADOPT_FIRST=1,  //新しい最頻値を採用(反応が早い)
   ENUM_MODE_ADOPT_LAST=2,   //古い最頻値を採用(反応が遅い)
   ENUM_MODE_ADOPT_AVERAGE=3    //最頻値の平均を採用
};

enum ENUM_RATE_NORMALIZE{
   ENUM_RATE_NORMALIZE_ROUND=1,  //高値四捨五入/安値五捨六入
   ENUM_RATE_NORMALIZE_EXPANSION=2,  //拡張(安値切捨/高値切上)
   ENUM_RATE_NORMALIZE_REDUCTION=3  //縮小(安値切上/高値切捨)
};

class RateData : public CObject{
   private:
      int rate;
      int count;
   public:
      RateData(void){
         rate=0;
         count=0;
      };
      RateData(int r,int c) : rate(r),count(c){};
      void SetRate(int r){
         rate=r;
      };
      int GetRate(){
         return rate;
      };
      void SetCount(int c){
         count=c;
      };
      int GetCount(){
         return count;
      };
};

input int period=20; //期間
input ENUM_RATE_NORMALIZE normalize=ENUM_RATE_NORMALIZE_REDUCTION;  //ポイント単位の処理方法
input ENUM_MODE_ADOPT adopt=ENUM_MODE_ADOPT_FIRST;  //最頻値複数出現時の処理方法
input int shift=0;   //シフト

double mode_buffer[];
int plot_begin=0;

int OnInit(){
   if (period <= 0){
      Alert("0以上の期間を指定する必要があります。");
      return INIT_PARAMETERS_INCORRECT;
   }
   SetIndexBuffer(0,mode_buffer);
   PlotIndexSetInteger(0,PLOT_SHIFT,shift);
   PlotIndexSetString(0,PLOT_LABEL,"Moving Mode("+IntegerToString(period)+")");
   PlotIndexGetInteger(0,PLOT_DRAW_BEGIN,period);
   return INIT_SUCCEEDED;
}
int OnCalculate(const int rates_total,
                const int prev_calculated,
                const datetime &time[],
                const double &open[],
                const double &high[],
                const double &low[],
                const double &close[],
                const long &tick_volume[],
                const long &volume[],
                const int &spread[]){
   if(rates_total<period){
      return 0;
   }
   if(plot_begin!=period+plot_begin){
      plot_begin=period+plot_begin;
      PlotIndexSetInteger(0,PLOT_DRAW_BEGIN,plot_begin);
   }
   int position=
      prev_calculated>1
         ? prev_calculated-1
         : 0;
   for(int i=position;i<rates_total&&!IsStopped();i++){
      if(i>=period){
         int int_low=0;
         int int_high=0;
         CArrayObj rd_array;
         CArrayObj tgt_array;
         int max_count=1;
         for(int j=0;j<period;j++) {
            if(normalize==ENUM_RATE_NORMALIZE_ROUND){
               int_low=(int)(low[i-j]/(Point()*10)+0.4);
               int_high=(int)(high[i-j]/(Point()*10)+0.5);
            }else if(normalize==ENUM_RATE_NORMALIZE_EXPANSION){
               int_low=(int)(low[i-j]/(Point()*10));
               int_high=(int)(high[i-j]/(Point()*10)+0.9);
            }else if(normalize==ENUM_RATE_NORMALIZE_REDUCTION){
               int_low=(int)(low[i-j]/(Point()*10)+0.9);
               int_high=(int)(high[i-j]/(Point()*10));
            }
            for(int k=int_low;k<=int_high;k++){
               if(rd_array.Total()>0){
                  bool exist=false;
                  for(int l=0;l<rd_array.Total();l++){
                     RateData *rd=rd_array.At(l);
                     if(rd.GetRate()==k) {
                        exist = true;
                        rd.SetCount(rd.GetCount()+1);
                        if(max_count<rd.GetCount()){
                           max_count=rd.GetCount();
                        }
                     }
                  }
                  if(!exist){
                     rd_array.Add(new RateData(k,1));
                  }
               } else {
                  rd_array.Add(new RateData(k,1));
               }
            }
         }
         for(int j=0;j<rd_array.Total();j++){
            RateData *rd=rd_array.At(j);
            if(rd.GetCount()==max_count){
               tgt_array.Add(rd);
            }
         }
         if(adopt==ENUM_MODE_ADOPT_FIRST){
            RateData *rd=tgt_array.At(tgt_array.Total()-1);
            mode_buffer[i]=rd.GetRate()*(Point()*10);
         }else if(adopt==ENUM_MODE_ADOPT_LAST){
            RateData *rd=tgt_array.At(0);
            mode_buffer[i]=rd.GetRate()*(Point()*10);
         }else if(adopt==ENUM_MODE_ADOPT_AVERAGE){
            int tgt_sum=0;
            for(int j=0;j<tgt_array.Total();j++){
               RateData *rd=tgt_array.At(j);
               tgt_sum+=rd.GetRate();
            }
            mode_buffer[i]=(tgt_sum/tgt_array.Total())*(Point()*10);
         }
      }
   }
   return rates_total;
}
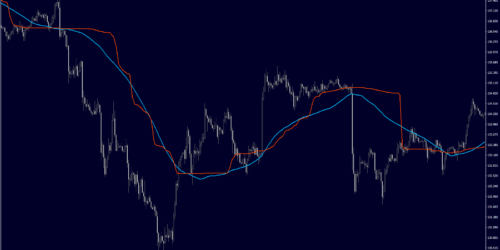
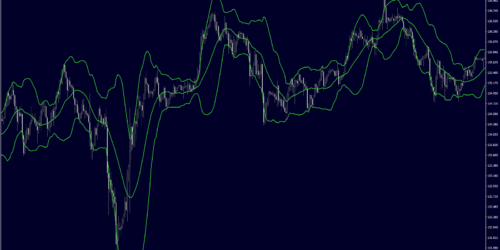
表示すると下図の赤線のように表示される。
比較のために同期間の移動平均線(青線)を表示している。

コンパイル済みのインジケータファイルは下のリンクからどうぞ。
なお、ローソク足1本1本を1pip単位で区切って処理するため、長期足や期間を長くして使用すると処理に時間がかかりすぎる場合がある。
(そもそも処理の仕方に問題があるかもしれないが。)
使用する際は、5分足くらいのチャートに適用することを推奨する。